How Many Jobs Should You Apply To? What the Data Says
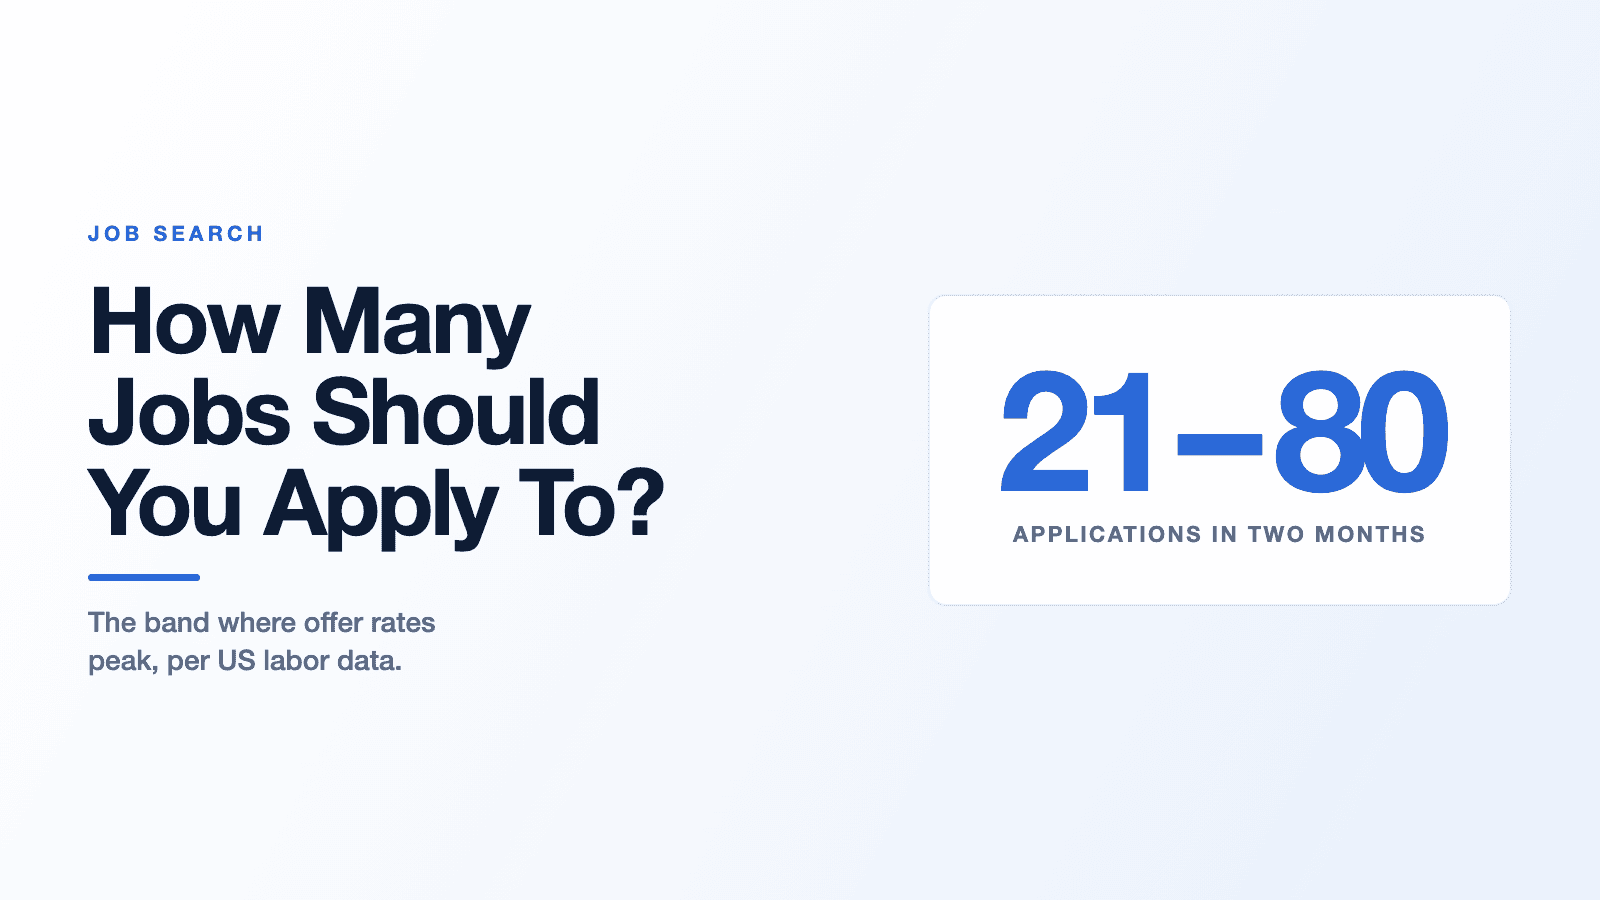
How many jobs should you apply to? If you have searched the question, you have already met the answer: two to three a day, ten to fifteen a week. It is on every career blog and in Google's own AI summary. None of them cite anything. The one nationally representative US dataset that measured applications, interviews and offers together found something different: jobseekers needed about six applications per interview, and offer rates were highest among people who sent 21 to 80 applications over two months, which works out to roughly three to nine a week.
That is the short version. The longer version is more useful, because the right number for you depends on a rate you can measure and a channel you can choose.
Where "two to three jobs a day" actually comes from
Indeed tells you to "apply to ten to fifteen different jobs each week, or two to three jobs per day." Kickresume says "approximately 2-3 jobs a day, or 10-15 jobs per week." ResumeWorded says "2-3 jobs per day, or around 10-15 jobs per week." Google's AI Overview for this question says to aim for "2 to 3 quality applications per day, or 10 to 15 per week," and lists its sources as Reddit, Quora, Indeed, Kickresume, JobWizard and ResumeWorded.
Read that list again. For a question that is purely numeric, the answer engine's evidence is two forum threads and three career blogs, none of which cites a study, a survey or a dataset.
I am not claiming the number is wrong. I am claiming nobody shows their work. Indeed's page links to exactly one dataset, and it is the Bureau of Labor Statistics series for average unemployment duration, which it quotes as 20.9 weeks. That reading is years out of date. The current figure is 24.9 weeks as of July 2026.
There is real data on this question. It is just nowhere near the top of the results.
What the US government data actually measured
In 2018, the Bureau of Labor Statistics added a set of job search questions to the Current Population Survey, the monthly survey of about 60,000 households that produces the national unemployment rate. Two BLS economists, Michael Dalton and Jeffrey Groen, published the results in Beyond the Numbers in November 2020. The sample is people who were unemployed at the time of the survey and had looked for work in the previous four weeks.
Their headline finding: "it took jobseekers on average six applications to obtain one interview."
The average jobseeker in that sample sent 13.67 applications and got 1.93 interviews. Here is the part that changes everything about how the rest of the internet uses this topic. The survey asked how many jobs people applied for in the last two months. Not per week. So the average is under two applications a week, about a seventh of what the standard advice prescribes.
The most interesting table is the one relating application volume to offers. Two months is about 8.7 weeks, so I have added a weekly-pace column; that column is my conversion, not the BLS's.
| Applications in two months | Roughly per week | Received a job offer |
|---|---|---|
| 0 | 0 | 13.21% |
| 1 to 10 | about 1 | 27.20% |
| 11 to 20 | 1 to 2 | 29.48% |
| 21 to 80 | about 3 to 9 | 30.89% |
| 81 or more | 9 or more | 20.36% |
Source: BLS, How do jobseekers search for jobs?, Table 3. Data from the May and September 2018 CPS supplements.
The curve rises, then falls. BLS puts it plainly: "the group that applied for 81 or more jobs was less likely to have received a job offer than those who applied to 21 to 80 jobs."
How many job applications per day should you send?
Now convert the standard advice into the same units as the evidence. Ten to fifteen applications a week, sustained over the two-month window the survey asked about, is 87 to 130 applications. That is the 81-or-more band, where the measured offer rate is 20.36%, below even the band of people who sent ten applications or fewer.
Before you act on that, understand what it is and is not.
This is a correlation in survey data, not an experiment. Nobody randomly assigned people to send 30 or 300 applications. BLS offers two explanations of its own, and both are about who ends up in that band rather than what the applications did. The first is that "jobseekers who apply for many jobs believe their chances of getting a job offer are lower, so that applying for more jobs is meant to balance a difficult job search." The second is that "these jobseekers have more urgency in finding a job and are therefore less targeted in their application process."
So this is not evidence that applying more will hurt you. It is evidence that beyond a certain volume, sending more applications stops buying more offers, and the people who send the most are not the people getting the most offers. Any advice that treats your weekly count as the scoreboard is measuring the wrong thing.
How many jobs should you apply for in a week?
If you want a number: three to nine real applications a week, the range where offer rates peaked. "Real" is doing the work in that sentence. An application you would not be embarrassed to have a recruiter read next to your resume counts. A one-click submission of the same generic PDF you sent to the last forty postings is a different activity that happens to share a name.
Your circumstances move the range. In the same study, people unemployed less than five weeks averaged 10.32 applications over two months, while those 15 to 26 weeks in averaged 17.22. People search harder as the months pass, which is human and rational. One honest caution from the same dataset: it does not get easier. Offer probability was 30.94% for people unemployed under five weeks and 18.44% for those past 27 weeks.
If you are employed and searching quietly, you cannot sustain nine a week and should not try. Three good ones is a real search. If you are unemployed and searching full time, the extra hours are better spent on the quality of each application and on the channels below than on pushing your count from nine to twenty. Either way, the only way to know whether your pace is working is to track your own application-to-interview rate.
Why 2026 is harder than a 2018 dataset makes it look
That BLS supplement is the best representative data available on this question, and it is also eight years old. The funnel has got worse since.
Ashby's 2026 Talent Trends Report, built on more than 109 million applications and 247,000 jobs from January 2021 to March 2026, found that "in 2021, approximately 7-8% of applications resulted in an interview. Today that figure sits between 3.6% and 4.7% depending on role type." Candidates are "roughly 50% less likely to receive an interview today than they were five years ago." The average recruiter is now processing 291 applications per hire, up from roughly 100 in early 2021, and Ashby's recruiters report a rise in AI-generated applications from automated tools.
Gem's 2025 Recruiting Benchmarks Report, covering over 140 million applicants and 1.3 million hires, reaches the same place from different data: an applicant is "3× less likely to get hired for a role today than three years ago," and average time to hire has gone from 33 days to 41.
The labor market underneath those numbers moved too. I pulled the BLS series directly. In January 2024 there were 8.38 million job openings and 6.18 million unemployed people, or 0.74 unemployed people per opening. By June 2026 openings were 7.36 million against 7.09 million unemployed, which is 0.96. That is about 31% more competition per opening in two and a half years.
One more thing that number hides. Across that entire series, monthly hires run at roughly seven for every ten openings. An opening is not a job somebody gets this month, and the count of open roles you can see is not the count of chances you have. That is why most of the job search tips that hold up in 2026 are about aiming each application rather than sending more. It also helps to know what an applicant tracking system actually screens on before you assume a rejection was about your resume.
Two credible sources, two very different interview rates
You may have noticed a contradiction. BLS says about one interview per six applications. Ashby says one per 21 to 28. Both are careful measurements. They disagree by a factor of four because they are counting different things.
The BLS survey counts every route to a job: small employers, walk-ins, staffing agencies, someone who knew someone, all of it, in 2018. Ashby counts online applications arriving in a modern applicant tracking system in 2026. One number covers every way people get hired. The other covers one channel, the one you are using when you click Apply on a posting.
Gem's channel data closes the argument. Job boards and social sites account for 49.0% of all applications but produce 24.6% of hires. A sourced, outbound applicant is "5× more likely to be hired than an inbound applicant."
Which door you go through moves your number more than how many times you knock.
Work out your own number
The market average is a starting point, not your answer. The formula is simple enough to run on a napkin:
applications needed = offers you want ÷ (your interview rate × your interview-to-offer rate)
Use Ashby's published rates to see what the average looks like. Its interview rate is 3.6% to 4.7%, and its offer conversion, measured among candidates who reach the interview process, is 7.3% for technical roles and 10.4% for business roles. Multiply them out. The arithmetic below is mine, not a figure Ashby publishes.
| Scenario | Interview rate | Offer conversion | Offers per application | Applications per offer |
|---|---|---|---|---|
| Business role, better case | 4.7% | 10.4% | 0.489% | about 205 |
| Technical role, harder case | 3.6% | 7.3% | 0.263% | about 381 |
So roughly one offer per 200 to 380 cold online applications at current market rates. As a sanity check, Ashby's separately reported figure of 291 applications per hire lands in the same range. It measures a different thing, applications an employer receives per hire made rather than one candidate's odds, so treat the agreement as corroboration rather than confirmation.
Those are averages for the lowest-yield channel. Yours will differ, and after 30 applications you can calculate it instead of guessing. Count applications sent, replies, first interviews and offers, and you have the two rates the formula needs.
Count applications in flight, not applications a day
A daily quota measures effort. It cannot measure progress, because the feedback arrives months later.
Ashby puts time to first fill at eight weeks for business roles and ten for technical ones. Gem's average time to hire is 41 days. Something you send today is resolving in late October. Meanwhile the average unemployed American has been searching about 24.9 weeks, roughly six months, though that is the mean among people currently unemployed rather than the length of a typical search.
The useful count is not how many you sent today. It is how many live applications you have, and what the next action is on each one, which is often a short follow-up to a named person.
What actually moves the number
The largest study on this is a 2021 meta-analysis in the Journal of Applied Psychology by van Hooft, Kammeyer-Mueller, Wanberg, Kanfer and Basbug, pooling 378 independent samples and 165,933 people. It measured how strongly job search intensity, meaning how hard and how much you search, relates to results.
Intensity correlated .23 with number of interviews, .14 with number of job offers, and .19 with whether someone was employed. In plain terms, those are real but modest relationships, and the one for offers is the weakest of the three. The line that should change how you plan your week is this: "Overall job-search intensity failed to predict employment quality." Search quality did predict both the count of outcomes and the quality of the job.
Volume buys interviews more than it buys offers, and it buys nothing at all about whether the job you land is any good.
Channel outranks your daily count by a distance. In Gem's data a sourced, outbound applicant is five times more likely to be hired than an inbound one. Time spent getting yourself sourced, which means being visible and reachable to the people doing the outreach, is working on the multiplier rather than the count.
Fit comes next. If you cannot point to evidence for the core requirement of a posting, that application is spending your week for a rounding error.
Then there is what you actually send, which mostly means tailoring your resume to the job description rather than sending one file to everything, writing a letter that reads like a person if you use AI to draft it, and making sure the file itself parses cleanly.
The obvious objection is time. Nine tailored applications a week is more work than 30 copy-pasted ones. That is the problem JobMason was built for: paste a job link and it produces a tailored resume, cover letter, hiring-manager email and answers to the application questions for that specific posting, so a full pack usually arrives in under a minute and you spend your time editing it rather than starting from a blank page. Tracking, analytics and all 12 resume templates are free; the AI generation is the paid part.
Whole categories of tools now sell the opposite bet, promising hundreds of automatic applications a week. The data above cannot tell you those tools make anyone worse off, and I am not claiming it does. What it does say is that the quantity they are selling is the input least likely to change your result.
FAQ
How many jobs does the average person apply to? Among unemployed US jobseekers in the BLS survey, the average was 13.67 applications and 1.93 interviews over a two-month period, which is under two applications a week. That figure comes from the May and September 2018 CPS supplements and covers people who were unemployed and actively looking, so it is not a benchmark for everyone, and application volumes have risen since.
What is the 70/30 rule in hiring? There is no standard, authoritative 70/30 rule. The phrase circulates in two incompatible ways: as employer advice to hire for about 70% of the required skills and 30% potential, and as candidate advice to apply when you meet roughly 70% of a posting's listed requirements. Neither traces to a primary research source or a professional standards body; the phrase mostly appears in social posts and HR blogs. Treat it as a rule of thumb somebody coined, not a finding.
Is applying for 3 jobs a day enough? It is more than enough by volume, and probably too many to do well. Three a day is 15 to 21 a week depending on weekends, or 130 to 183 over two months, which puts you in the band where the BLS data shows offer rates falling rather than rising. If you can genuinely tailor three a day, you are applying at something like ten times the pace of the average jobseeker in the BLS sample, and volume is not your problem. If you are hitting three a day by resending one resume, adding a fourth is the least likely change to alter the outcome.
Is applying to 7 jobs a lot? Seven in a week is about 61 over two months, which sits inside the 21-to-80 band with the highest measured offer rate in the BLS data. So no, it is not a lot. By that measure it is close to the right neighborhood, assuming each of the seven is a real application.
So, how many jobs should you apply to?
Every figure in this post is a market average, and none of them is about you. Go back through your last 30 applications and count the replies and first interviews. That gives you your own interview rate, and the moment you have it, the question stops being how many jobs you should apply to and becomes how many you need to send at the rate you currently convert. If it is down near the one-in-21-to-28 that Ashby measures for cold online applications, more applications is the expensive answer. Fixing what you send is the cheap one.
Sources
- Michael R. Dalton and Jeffrey A. Groen, How do jobseekers search for jobs? New data on applications, interviews, and job offers, Beyond the Numbers vol. 9 no. 14, US Bureau of Labor Statistics, November 2020, from a Current Population Survey supplement in May and September 2018: it took jobseekers on average six applications to obtain one interview; the average jobseeker sent 13.67 applications and had 1.93 interviews over two months; probability of receiving a job offer was 27.20% for 1 to 10 applications, 29.48% for 11 to 20, 30.89% for 21 to 80 and 20.36% for 81 or more; jobseekers with at least one interview had about a 37% chance of an offer against about 10% for those with none; offer probability was 30.94% for people unemployed under five weeks and 18.44% for those unemployed 27 weeks or more.
- Ashby, Recruiter Productivity, 2026 Talent Trends Report (published 28 April 2026; over 109 million applications and 247,000 jobs, January 2021 to March 2026): about 7-8% of applications resulted in an interview in 2021 against 3.6% to 4.7% today; candidates are roughly 50% less likely to receive an interview than five years ago; the average recruiter processes 291 applications per hire against roughly 100 in early 2021; offer conversion among candidates who reach the interview process reached 10.4% for business roles and 7.3% for technical roles by Q1 2026; time to first fill has settled at 8 weeks for business roles and 10 weeks for technical roles.
- Gem, 10 takeaways from the 2025 Recruiting Benchmarks Report (over 140 million applicants and 1.3 million hires, January 2021 to December 2024): job boards and social sites account for 49.0% of applications but 24.6% of hires; a sourced, outbound applicant is 5x more likely to be hired than an inbound applicant; an applicant is 3x less likely to get hired for a role today than three years ago; average time to hire rose 24% to 41 days from 33.
- Edwin A. J. van Hooft, John D. Kammeyer-Mueller, Connie R. Wanberg, Ruth Kanfer and Gokce Basbug, Job search and employment success: A quantitative review and future research agenda, Journal of Applied Psychology 106(5), 674-713 (2021), DOI 10.1037/apl0000675, meta-analysis of 378 independent samples and 165,933 people: job-search intensity predicted quantitative employment success at rc = .23 for number of interviews, rc = .14 for number of job offers and rc = .19 for employment status, while overall job-search intensity failed to predict employment quality; job-search quality predicted both.
- US Bureau of Labor Statistics, Job Openings and Labor Turnover Survey, total nonfarm job openings, seasonally adjusted (JTS000000000000000JOL) and hires (JTS000000000000000HIL), retrieved via the keyless BLS public API: 8.38 million openings in January 2024 against 7.36 million in June 2026, with monthly hires running at roughly seven for every ten openings across the series.
- US Bureau of Labor Statistics, Current Population Survey series LNS13000000, unemployment level, seasonally adjusted: 6.18 million in January 2024 against 7.09 million in June 2026. Combined with the JOLTS openings series this gives 0.74 unemployed people per job opening in January 2024 against 0.96 in June 2026, about 31% more competition per opening.
- US Bureau of Labor Statistics, Current Population Survey series LNS13008275, Average Weeks Unemployed, seasonally adjusted: 24.9 weeks in July 2026. This is the mean duration among people currently unemployed, not the length of a typical job search.